Table of Contents
Out of services available on AWS, its monitoring “CloudWatch” service is one of the important among all in order to be an “AWS expert“. Further, its EC2 service which sometimes called as the backbone of the AWS is the most used service to date. Further, there are times when we want to monitor things of an EC2 Instance like CPU Utilization, Disk Usage, Network Performance, etc. So, today we are going to learn about “Detailed Monitoring for EC2 Instance“.
Note: The detailed monitoring does not come under the “free tier” terms of aws, so keep that in mind, you might get charged for your actions.
Before going further, make sure you read -> How to create a billing alarm on AWS CloudWatch (Step by Step)
Step 1: Create and Configure EC2 Instance
Create a new EC2 instance, to learn more about creating an EC2 Instance, read -> Create an instance on AWS (complete guide)
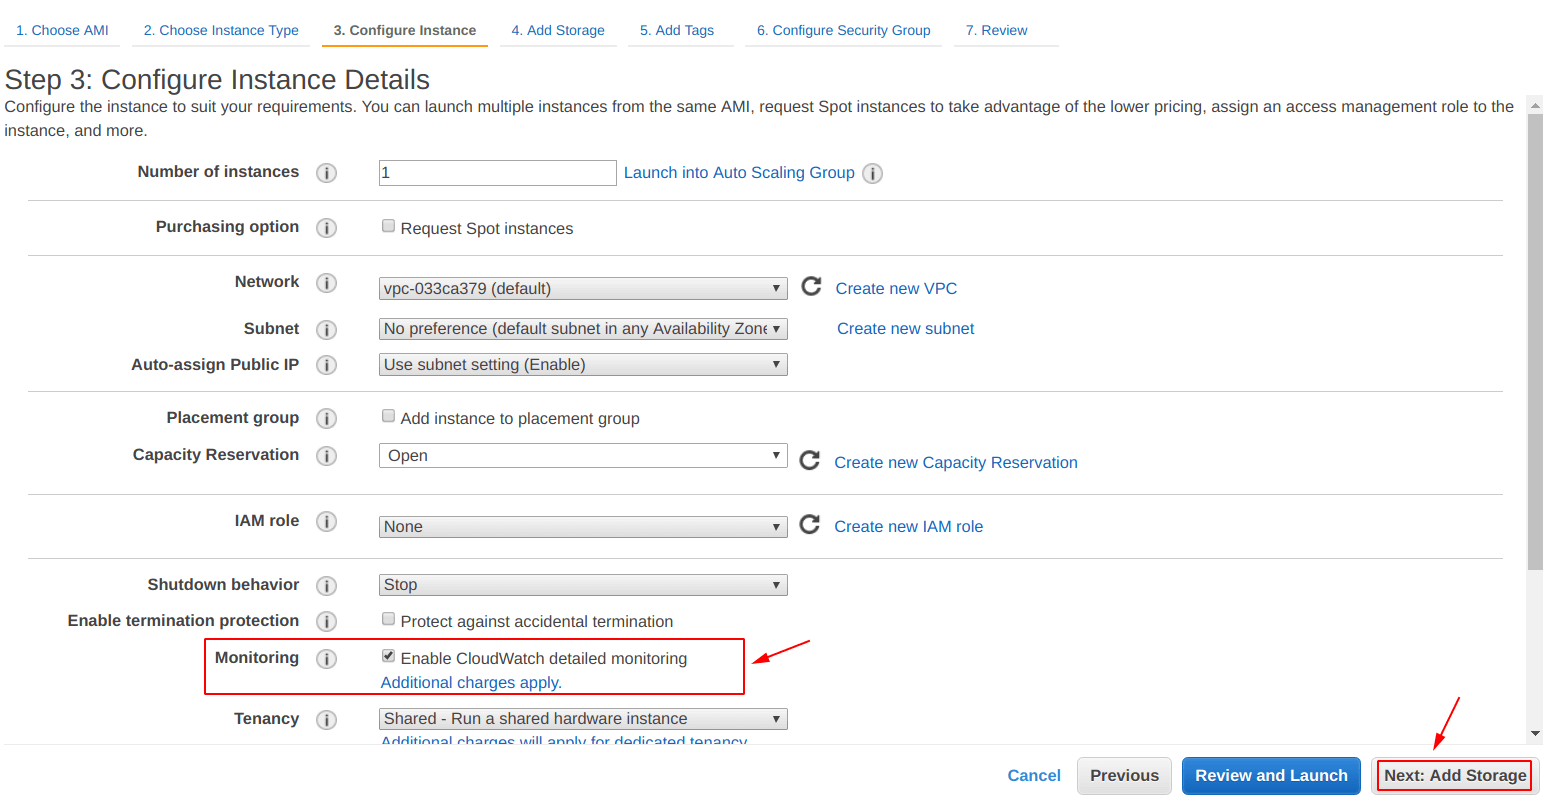
Note: From the picture below, make sure you check the “Enable CloudWatch detailed monitoring” box.
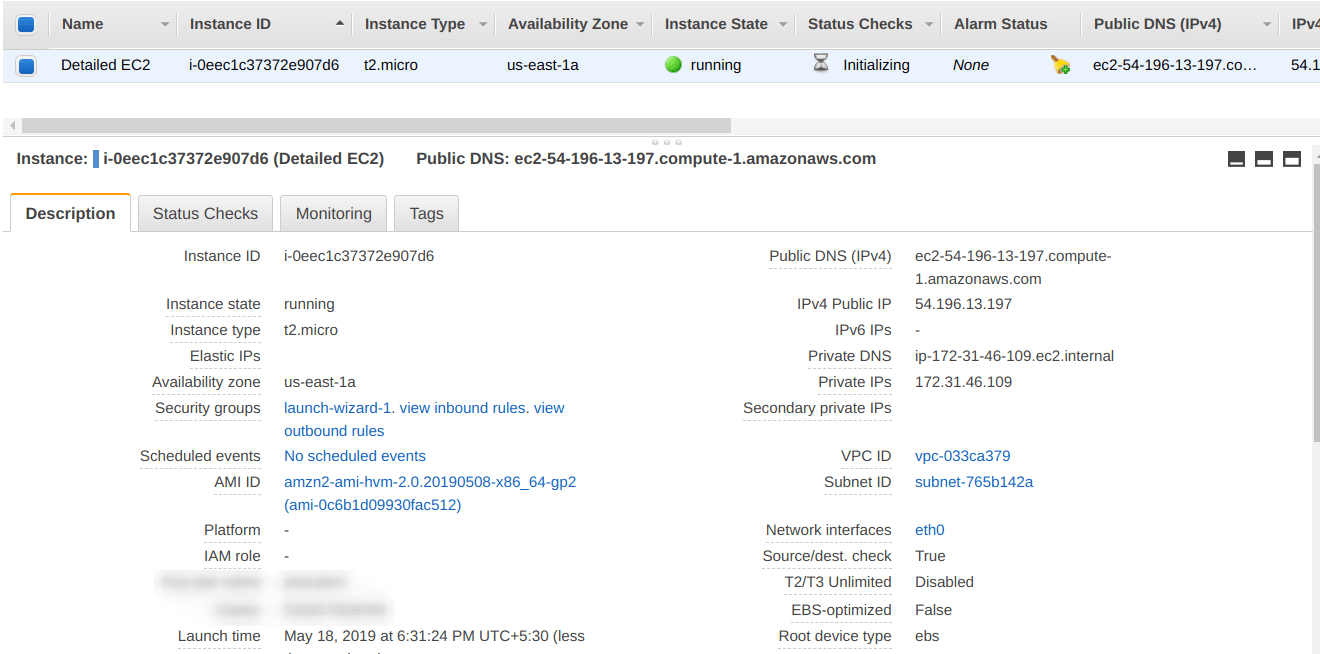
From the screenshot below, we can confirm that our new EC2 instance (Detailed EC2) has been successfully created.
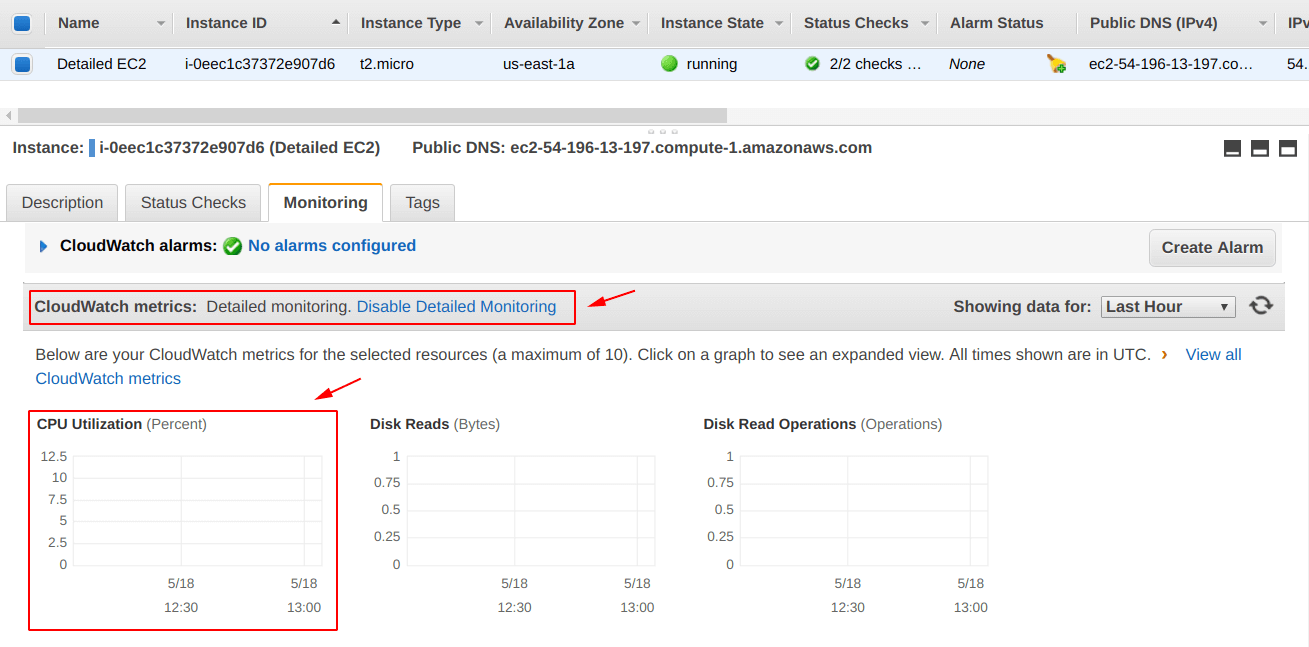
Look at the “CPU Utilization” it is currently not showing anything, because there is no load on the machine as of now.
Also, CloudWatch alarms: No alarms configured
Step 2: Create a CloudWatch Alarm
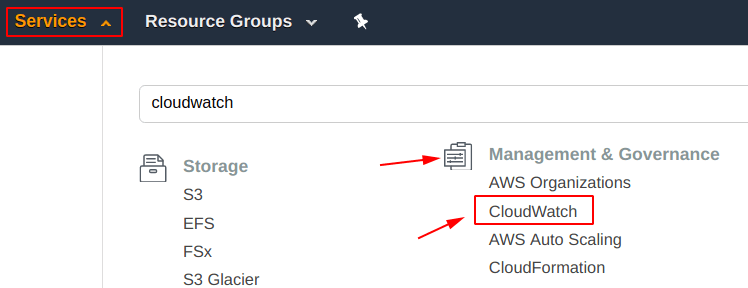
Select the “CloudWatch” service as shown in the image below.
After selecting the “CloudWatch” service, you will be seeing something like shown below. On this screen, we can see that currently there are “No records found” for the Alarms.
Click on the “Create Alarm” icon in order to create one.

Now, we have to select a type of “Metric” for the alarm.
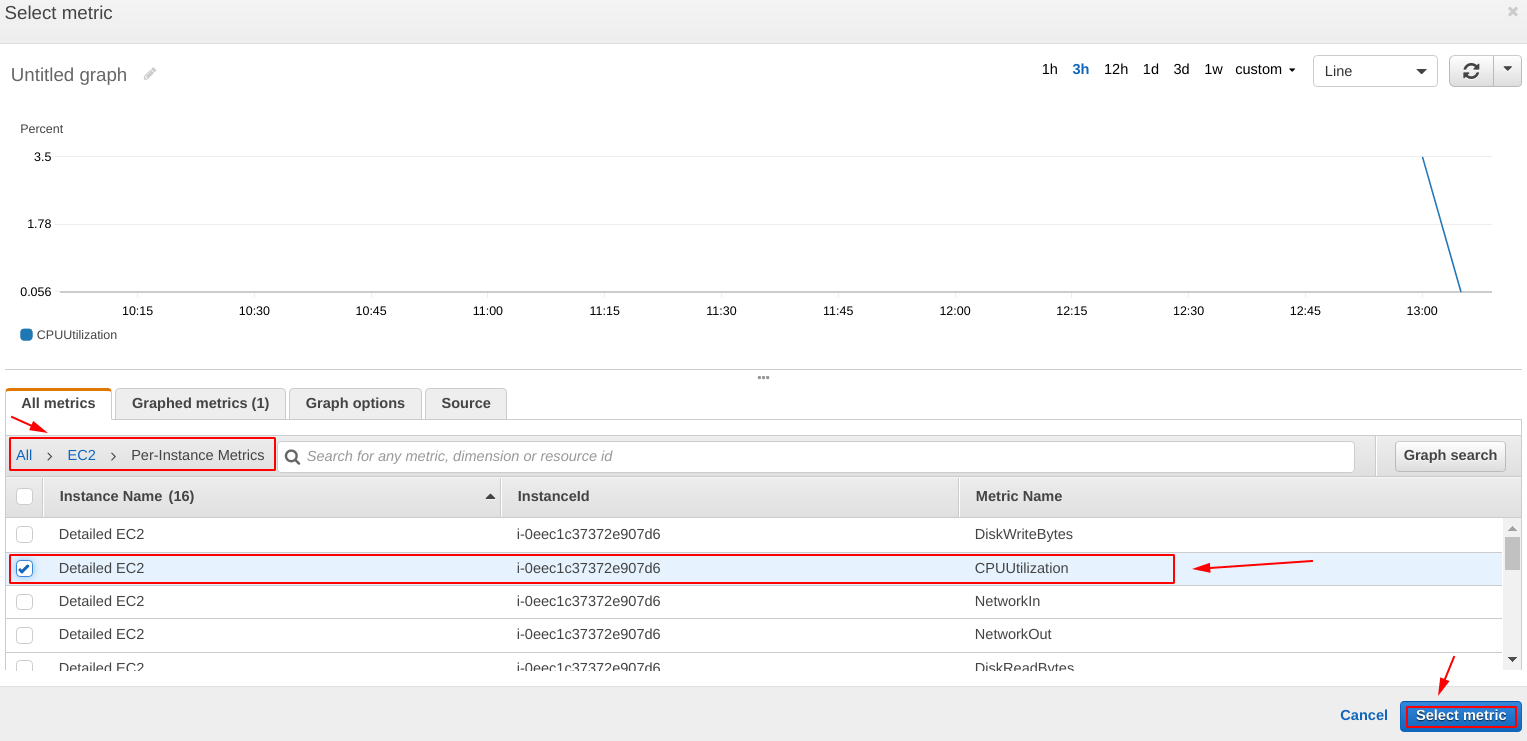
From the photo below, notice we have navigated to “ALL > EC2 > Per-Instance Metrics” and under that, we have selected “Detailed EC2” which is the name of “EC2 instance” we have created in “Step 1“.
Notice, we have selected the “Metric Name = CPUUtilization” because we want to monitor the CPU of Instance.
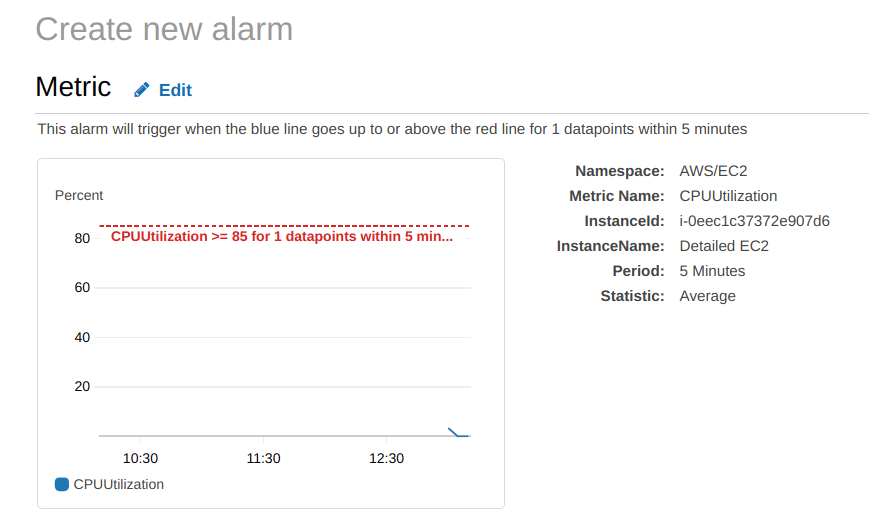
We are going to make a condition, as if the “CPU Utilization >= 85%” then please send an email for notifying about the same to the account holder.
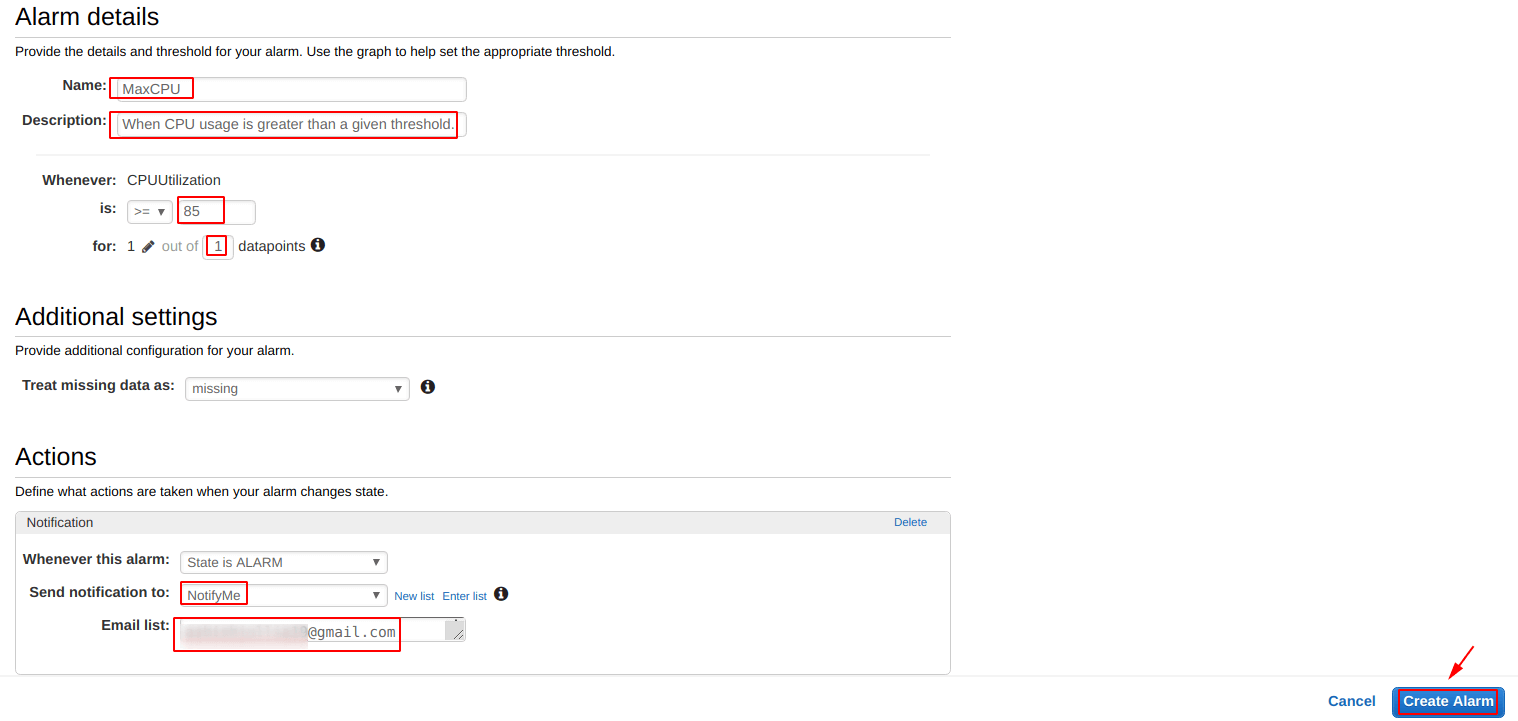
Provide or specify the details for the alarm as we did in our case. You can specify the things as per your needs or requirements.
We have filled up the following details:
- Name = MaxCPU
- Description = When CPU usage is greater than a given threshold
- Whenever -> CPUUtilization is >= 85% for 1 out of 1 data points
- Send notification to = “provide your details”
- Email list = “specify your email you want to get notified on”
After that, click on the “Create Alarm“.
Details – Detailed Monitoring for EC2 Instance
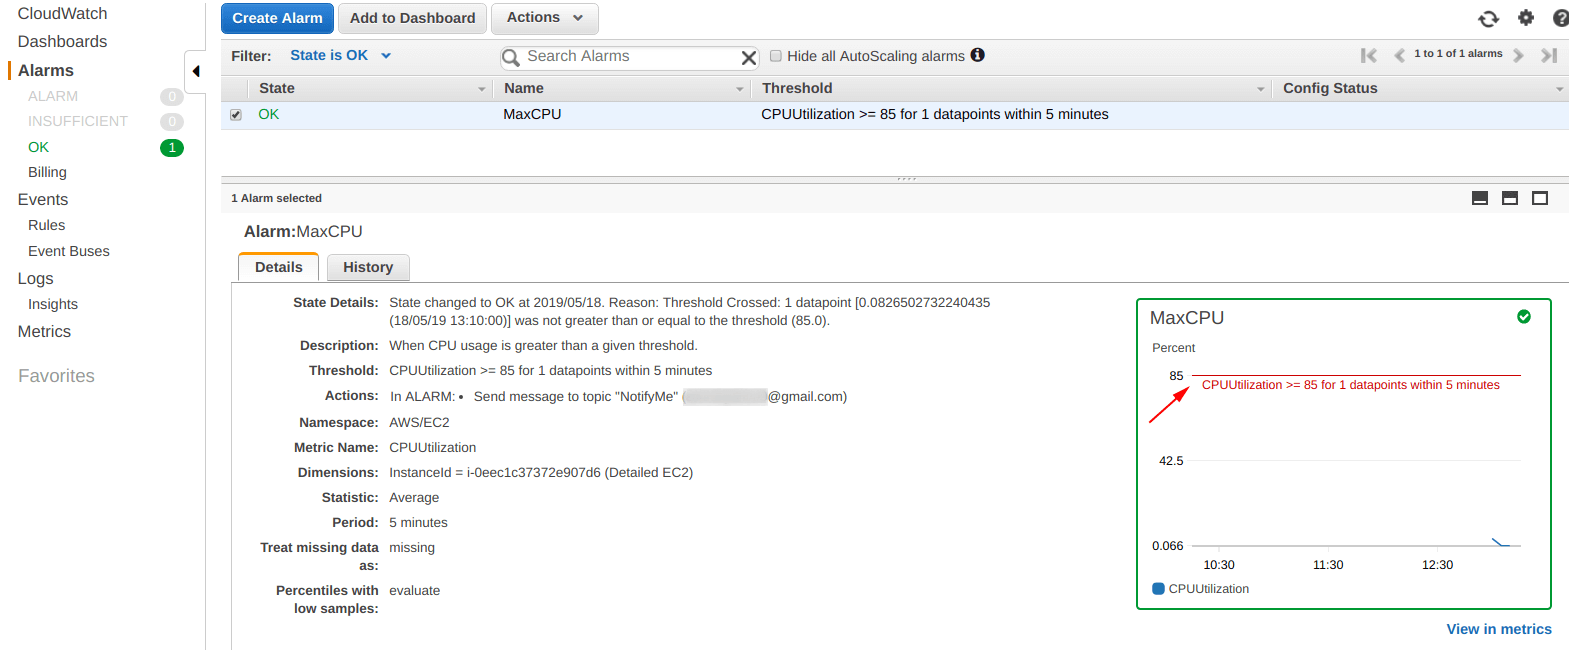
We can confirm that our “detailed cloudwatch” alarm has been set for the EC2 instance, but it is currently showing “INSUFFICIENT_DATA“.

Wait for a minute or two, you will be seeing an “OK” as shown below. Also, note that the “MaxCPU” graph is showing a “red line” showing the threshold value for the alarm.
Step 3: Login into the EC2 Instance
If you do not know, how to login into an EC2 instance, follow -> Login into the EC2 instance

Step 4: Exhaust the CPU
Here, in this step, we are going to create an infinite loop so that our CPU’s usage will go as high as possible and as a result, it will trigger the alarm we just created in “Step 2“.

Step 5: Observe Results for Detailed Monitoring for EC2 Instance
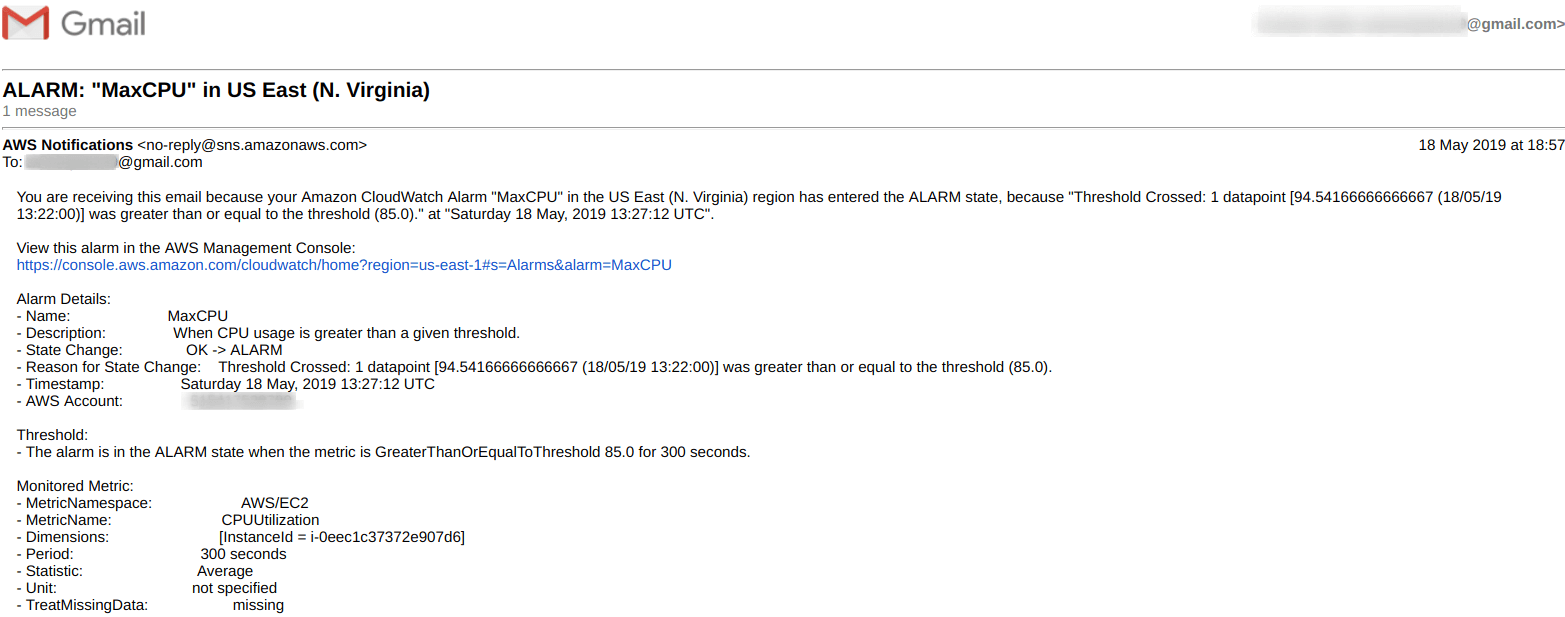
From the picture below, we can confirm that our “CloudWatch” alarm is working perfectly, as we have been notified on “CPU Exhaustion“.
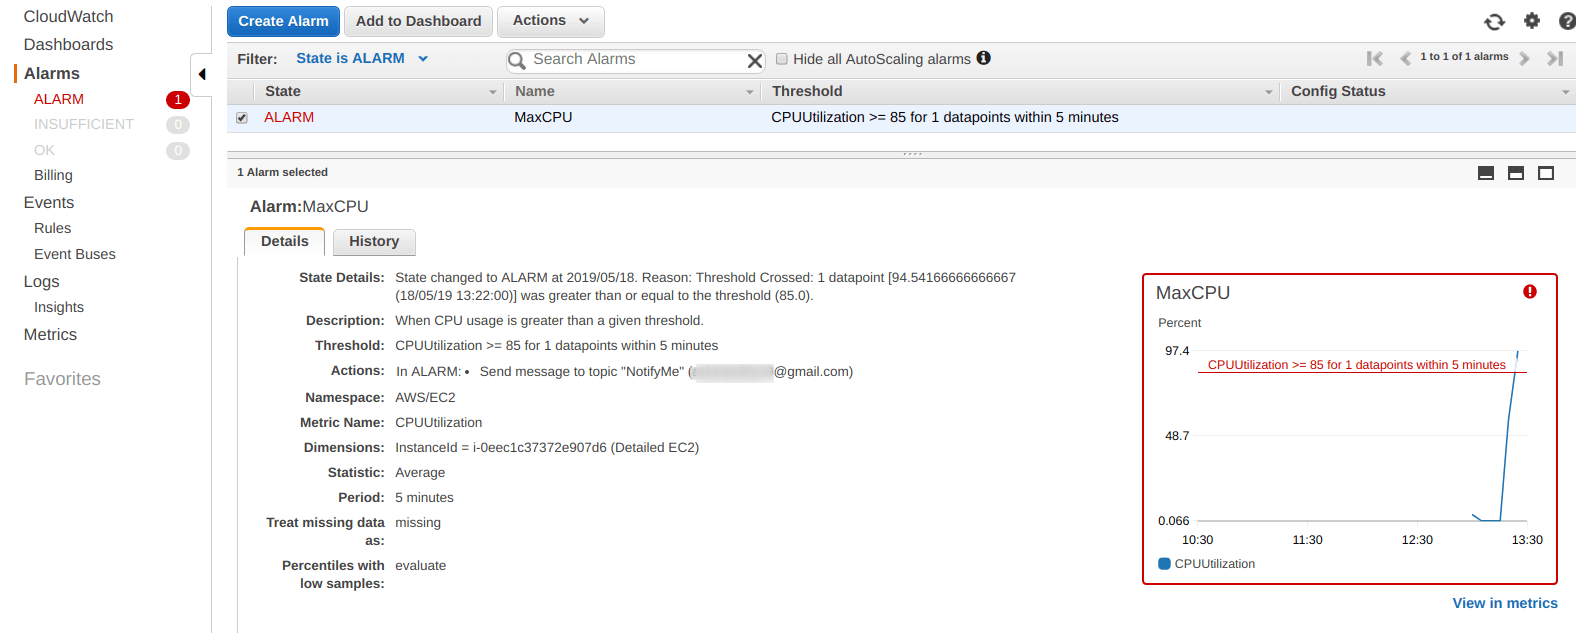
Now, if come back to the “CloudWatch dashboard” we can see that an Alarm is showing under the “Alarms” which means it is working perfectly.
Also, “Alarm Status = Alarm” is also highlighted inside the “EC2 instance details” as well.

More on AWS:
